Know your Data – your Research

Introduction
The last week of our Spring 2021 quarter was a special one. It was the quarter we all finally received our long-awaited Capstone project assignments. My assigned Capstone project was exciting, for I received the project of my choice and was now part of a great team. However, learning about the project and its many goals was just the beginning; the challenges were yet to come. I have always wanted to work on wetlands research. The Capstone project became more thrilling because of its goal to evaluate the success of coastal wetland restoration projects relative to regional recovery objectives with our community partner – Southern California Coastal Water Research Project (SCCWRP). The project’s scope and objectives seemed broad at first, but the kickoff meeting with SCCWRP and Science Advisors (Dr. Henry and Dr. Kimball) gave me clarity on the more narrowed and systematic steps we needed to follow our project goal. The meeting was crucial to learn about the project and its goal and be confident about our objectives and journey.
Struggle
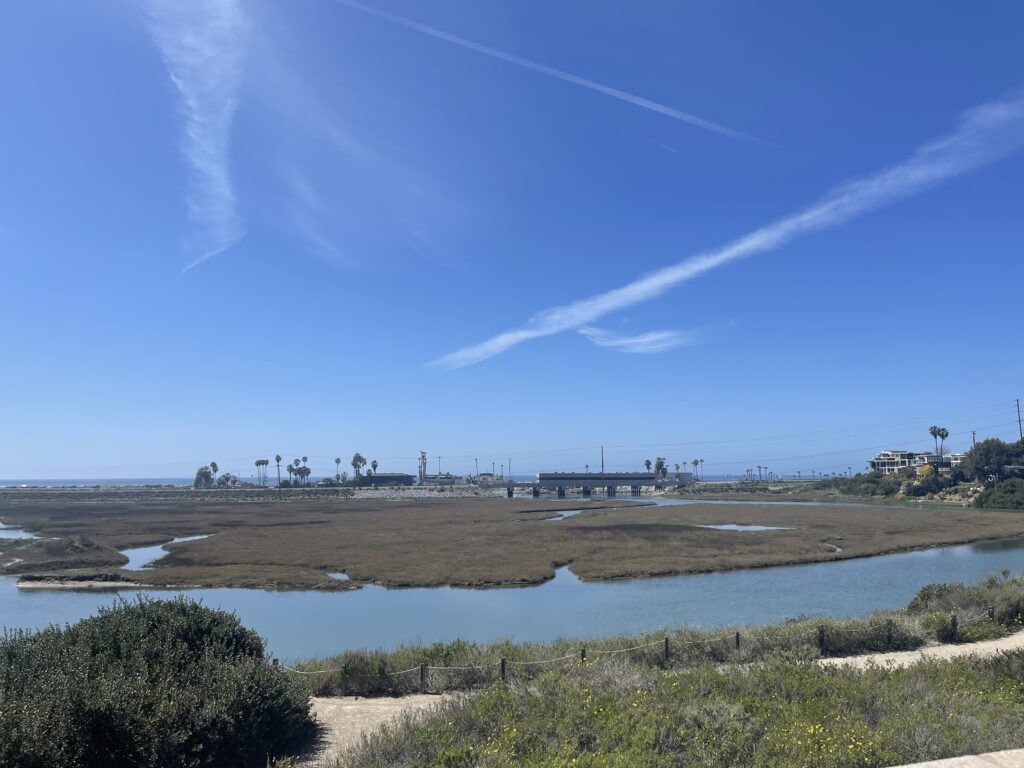
After I learned about the status of wetlands in Southern California that have been degraded due to intense urbanization and flood control activities over the past century, my struggle was the data compilation of the restoration sites. Since ca. 1850, there has been an overall loss of 9,317 hectares (out of 19,591 hectares) or 48 % of historical estuarine habitat types along the Southern California coast (Stein et al. 2014). Habitat restoration has become a focal initiative to restore the degraded wetlands (NRC 2001). Several projects and initiatives have been implemented to restore the coastal wetlands. For instance, through the Southern California Wetlands Recovery Project (WRP) partnership, public agencies, scientists, and local communities work cooperatively to acquire and restore wetlands in coastal Southern California (SCWRP 2020).
These restoration projects, including pre-restoration data and post-restoration monitoring, are all conducted by separate organizations with minimal collaboration, communication, or oversight. The individual methodologies and differing restoration objectives result in a lack of compatibility between restoration projects which then results in more challenges in evaluating the success of these projects. There is also little understanding of the efficacy of these restoration actions as they relate to regional assessments of individual sites and the region. Therefore, we worked with our community partner to establish the project’s work plan and listed the priority sites (10 projects) for the evaluation. We planned to assess coastal and inland estuarine restoration sites across the Southern California region, including Malibu Lagoon, Carpinteria Salt Marsh, and Huntington Beach Wetlands. At this point, we realized the challenge of generating crucial data from the monitoring reports. The challenge got even more significant because we did not have access to all the reports of the sites we selected for the Capstone. However, our community partner provided several reports to get us started on our data collection, and we were able to retrieve some of the reports from the project websites. Additionally, our Science Advisors helped to extract some of the reports too. We are still working on acquiring more reports through contacting the stakeholders, and community partners and science advisors are assisting us in making sure we get them sooner.

Resolution
As data collection and its analysis are essential in research, it also helps researchers interpret the findings of any project to achieve the project goal (Kentula et al., 2004). The monitoring reports from our reviewed sites had their own metrics that made data collection challenging to organize. We had several rounds of meetings with the community partner, Science Advisors, and outreach amongst our peers to discuss various facets of our project. This includes formatting the spreadsheets, data collection methodology, identifying common indicators, and organizing them together. Finally, with time, hard work, and team cohesion, we established a standard spreadsheet for the data collection. We grouped the metrics used in the monitoring reports in physical, hydrology, water quality, invertebrates, biological, and CRAM categories.
Furthermore, we divided each category into sub-categories, and we input the metrics that we identified from the monitoring reports in the adjacent categories. Currently, we are reviewing the reports and will continue to collect and compile data and are set to complete by the end of the Winter 2022 quarter. Once we have complete data, we plan to review, analyze, and generate results to achieve our Capstone goal.
References
Kentula, M.E., Gwin, S.E. & Pierson, S.M. (2004). Tracking changes in wetlands with urbanization: Sixteen years of experience in Portland, Oregon, USA. Wetlands 24, 734–743 https://doi.org/10.1672/0277-5212(2004)024[0734:TCIWWU]2.0.CO;2
National Research Council 2001. Compensating for Wetland Losses Under the Clean Water Act. Washington, DC: The National Academies Press. https://doi.org/10.17226/10134
Southern California Wetlands Recovery Project Work Plan 2020.
Stein D., Cayce K., Salomon M., Liza B., Mello D. D, Grossinger R., & Dark S. (2014). Wetlands of the Southern California Coat – Historical Extent and Change Over Time. SCCWRP Technical Report 826. SFET Report 720.
